1. Visualize data with Foxglove
1.1. Background
This tutorial explains how to record data with DDS Recorder tool and visualize it with Foxglove Studio.
1.2. Prerequisites
It is required to have eProsima DDS Record & Replay previously installed using one of the following installation methods:
Additionally, we will use ShapesDemo as a DDS Demo application to publish the data that will be recorded. This application is already prepared to use Fast DDS DynamicTypes, which is required when using the DDS Recorder tool. Download eProsima Shapes Demo from eProsima website or install it by following any of the methods described in the given links:
1.3. Configuring DDS Recorder
The DDS Recorder runs with default configuration parameters, but can also be configured via a YAML file. In this tutorial we will use a configuration file to change some default parameters and show how this file is loaded. The configuration file to be used is the following:
dds:
  domain: 0

recorder:
  output:
    filename: "shapesdemo_data"
    path: "."
The previous configuration file configures a recorder in DDS Domain 0 and save the output file as shapesdemo_data_<YYYY-MM-DD_hh-mm-ss>.mcap, being <YYYY-MM-DD_hh-mm-ss> the timestamp of the time at which the DDS Recorder started recording.
Create a new file named conf.yaml and copy the above snippet into this file.
1.4. Running the application
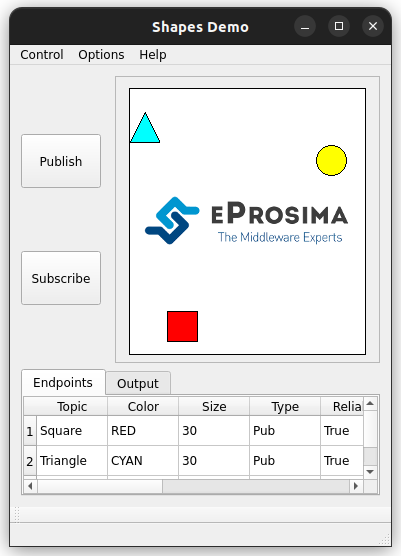
1.4.1. Start ShapesDemo
Launch eProsima Shapes Demo application running the following command:
ShapesDemo
Start publishing in topics Square, Triangle, and Circle with default settings:
1.4.2. Recorder execution
Launch the DDS Recorder tool passing the configuration file as an argument:
ddsrecorder -c <path/to/config/file>/conf.yaml
Once you have all the desired data, close the DDS Recorder application with Ctrl+C.
Important
Please remember to close the DDS Recorder application before accessing the output file as the .mcap file needs to be properly closed.
1.4.3. Visualize data with Foxglove Studio
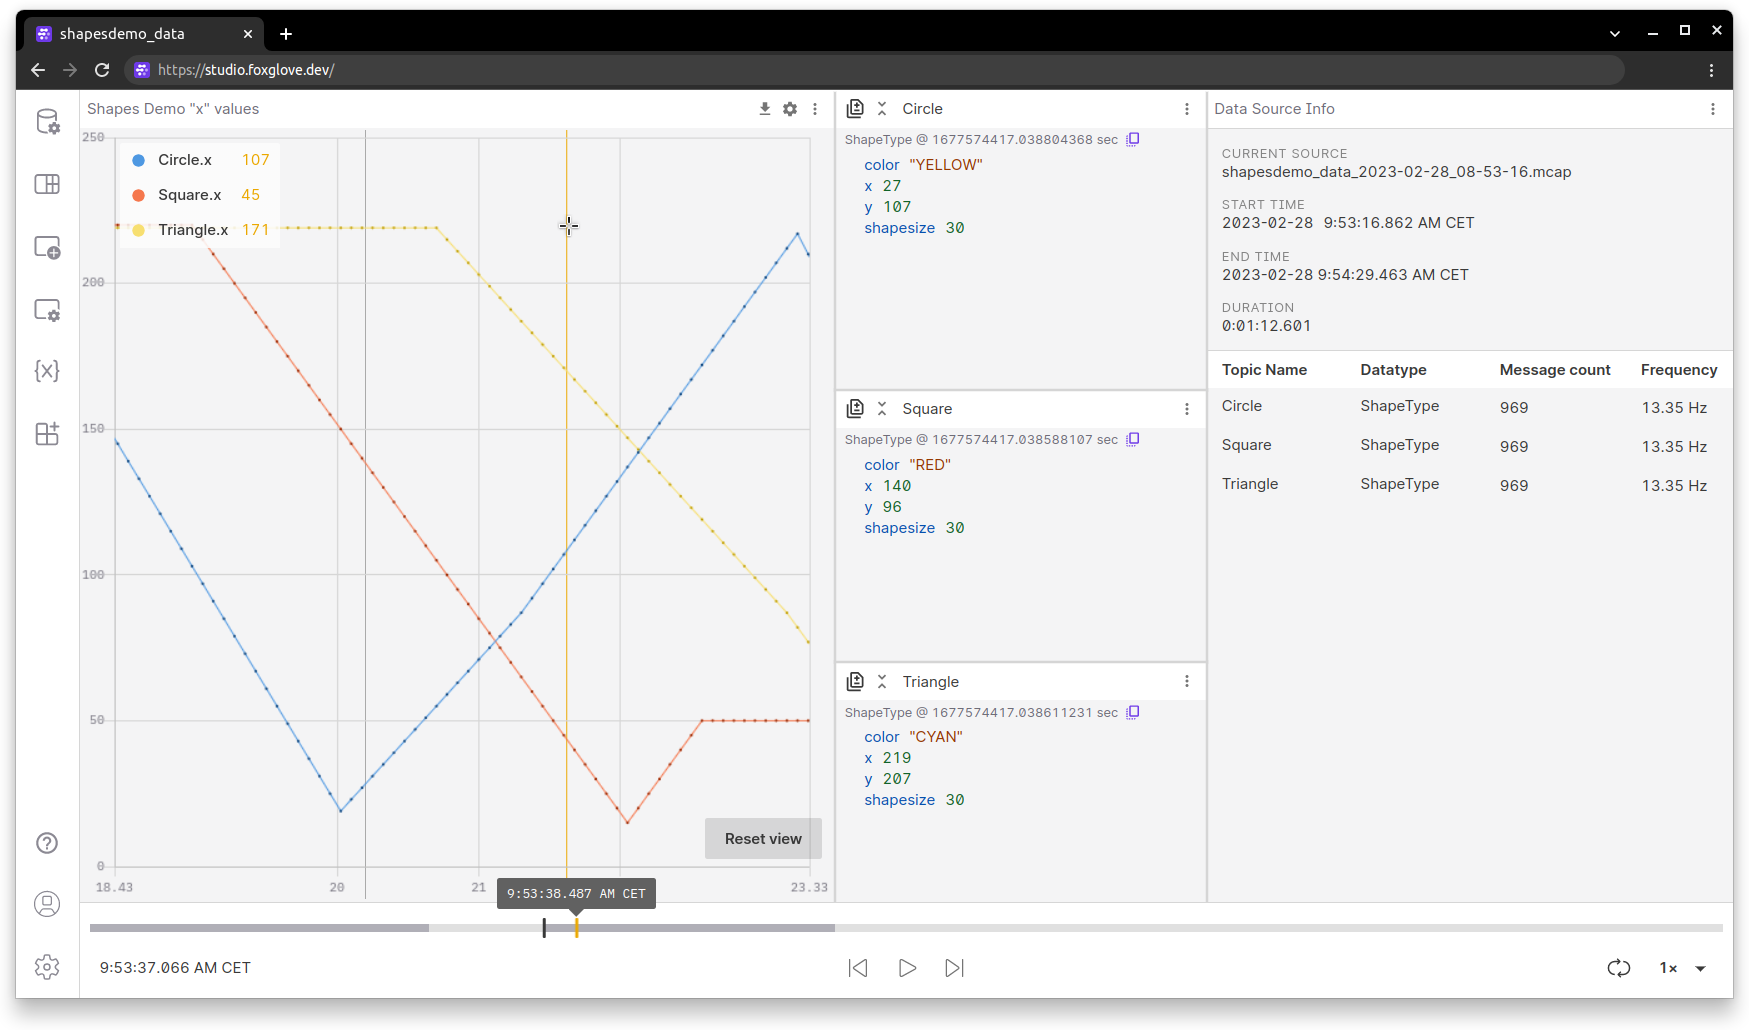
Finally, we will show how to load the generated MCAP file into Foxglove Studio in order to display the saved data.
Open Foxglove Studio web application using Google Chrome or download the desktop application from their Foxglove website. We recommend to use the web application as the it is usually up to date with the latest features.
Click
Open local fileand load the .mcap file previously created:shapesdemo_data.mcap.Once the .mcap file is loaded, create your own layout with custom panels to visualize the recorded data. The image below shows an example of a dashboard with several panels for data introspection.
Feel free to further explore the number of possibilities that eProsima DDS Recorder and Foxglove Studio together have to offer.